Tutorial
This will be a quick tutorial for importing and analyzing already cleaned mast data from Windographer. For the time being this will probably depend on EDF internal data. If an organization has quality controlled, publically available data I’d be happy to update this and host it on GitHub.
Import initialization
1 2 3 4 5 6 7 | import anemoi as an
import pandas as pd
import numpy as np
import matplotlib.pyplot as plt # for plotting
from IPython.core.display import display, HTML
display(HTML("<style>.container { width:99% !important; }</style>"))
|
Importing data and creating a MetMast
There are currently two different ways to import MetMasts into a Notebook. One is to read a .csv file assuming the Windographer output format and the other is the read already saved mast data in the parquet format using the pyarrow python package where the data and metadata are stored in two separate files.
Alternately, you can create a mast from scratch:
You have now successfully created your first mast mast using anemoi. Your output should look like the following:
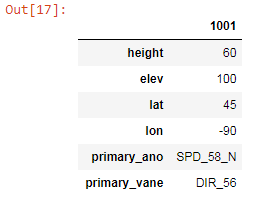
Mast 1001
# of sensors: 4
Coords: 45.0, -90.0
Primary ano: SPD_58_N
Primary vane: DIR_56
An analyst should now be able to look at the data and metadata stored within the MetMast object.
Similar pandas DataFrames should be shown. One with the mast metadata:
and one with the mast data (random values for the actual measured data):
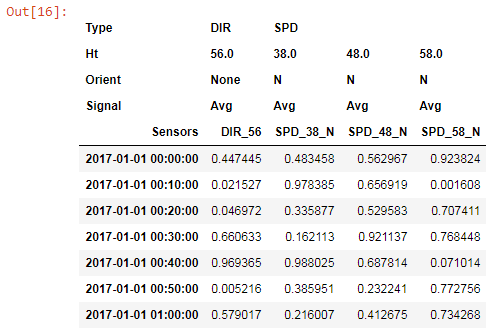
With these two tables you can see the data model being used for the MetMast object. Sensor type, height, orientation, and signal information are all being extracted from the sensor name. This allows anemoi to intelligently extract valuable information for shear, long-term, and frequency distribution calculations. You can read more about the data model here.
Analysis
The analysis capabilities of anemoi are still under construction. This will be filled out with the main analysis methods around long-term correlations, shear, and frequency distribution.